import pandas as pd부트스트랩(Bootstrap)
부트스트랩은 표본을 복원추출하고 각 표본에 대한 통계량과 모델을 다시 계산하는 것입니다.
부트스트랩은 부족한 데이터 포인트를 채우기 위한 기술이 아니라, 표본통계량의 변동성을 평가하기 위한 도구로 사용할 수 있습니다.
loans_income 데이터는 practical statstics for data science 에서 참고했습니다.
loans_income = pd.read_csv('https://raw.githubusercontent.com/gedeck/practical-statistics-for-data-scientists/master/data/loans_income.csv')loans_income.head()| x | |
|---|---|
| 0 | 67000 |
| 1 | 52000 |
| 2 | 100000 |
| 3 | 78762 |
| 4 | 37041 |
파이썬에서 부트스트랩을 구현하기 위한 함수는 아래와 같이 작성할 수 있습니다.
- 결과를 담을 빈 리스트(
results)를 생성합니다. N번 만큼,loans_income에서n_samples개의 중간값(median)을 계산하여 리스트에 추가합니다.
from sklearn.utils import resampledef boot(n_samples=20, N=1000):
results = []
for i in range(N):
m = resample(loans_income, n_samples=n_samples).median()[0]
results.append(m)
return results50000개의 모집단에서 100개의 표본을 추출하여 중간값을 계산합니다. 그 과정을 1000번 반복합니다.
results = boot(n_samples=100, N=1000)구해진 results에 대해 신뢰구간을 구할 수 있습니다.
results.sort()90% 신뢰구간이라면, 분포 양쪽 끝의 \([(100-90)/2]\%\)에 해당하는 점에서 자릅니다.
import numpy as npl = np.quantile(results, q=((100-90)/2)*0.01)
h = np.quantile(results, q=((100-(100-90)/2))*0.01)import matplotlib.pyplot as pltplt.rc('font', family='NanumBarunGothic')plt.hist(results)
plt.axvline(x=l, linestyle=':')
plt.axvline(x=h, linestyle=':')
print(l,h)28000.0 134607.40000000043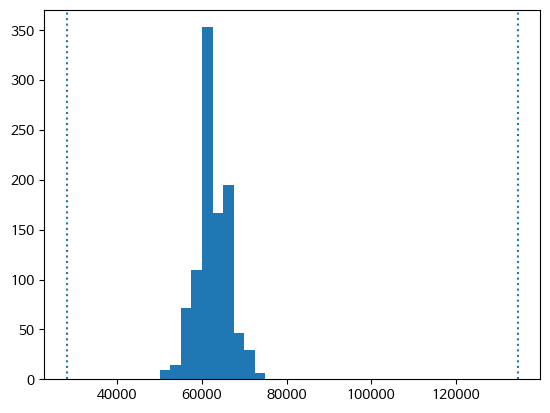
실제 income의 분포와 비교하면 어떨까요?
l = np.quantile(results, q=((100-90)/2)*0.01)
h = np.quantile(results, q=((100-(100-90)/2))*0.01)
fig, axs = plt.subplots(ncols=2, figsize=(15,8))
axs[0].hist(results)
l = np.quantile(results, q=((100-90)/2)*0.01)
h = np.quantile(results, q=((100-(100-90)/2))*0.01)
axs[0].axvline(x=l, linestyle=':')
axs[0].axvline(x=h, linestyle=':')
axs[0].set_title('Bootstrap(표본 샘플의 중간값 분포)')
axs[1].hist(loans_income)
l = np.quantile(loans_income, q=((100-90)/2)*0.01)
h = np.quantile(loans_income, q=((100-(100-90)/2))*0.01)
axs[1].axvline(x=l, linestyle=':')
axs[1].axvline(x=h, linestyle=':')
axs[1].set_title('Population(개별 레코드의 분포)')Text(0.5, 1.0, 'Population(개별 레코드의 분포)')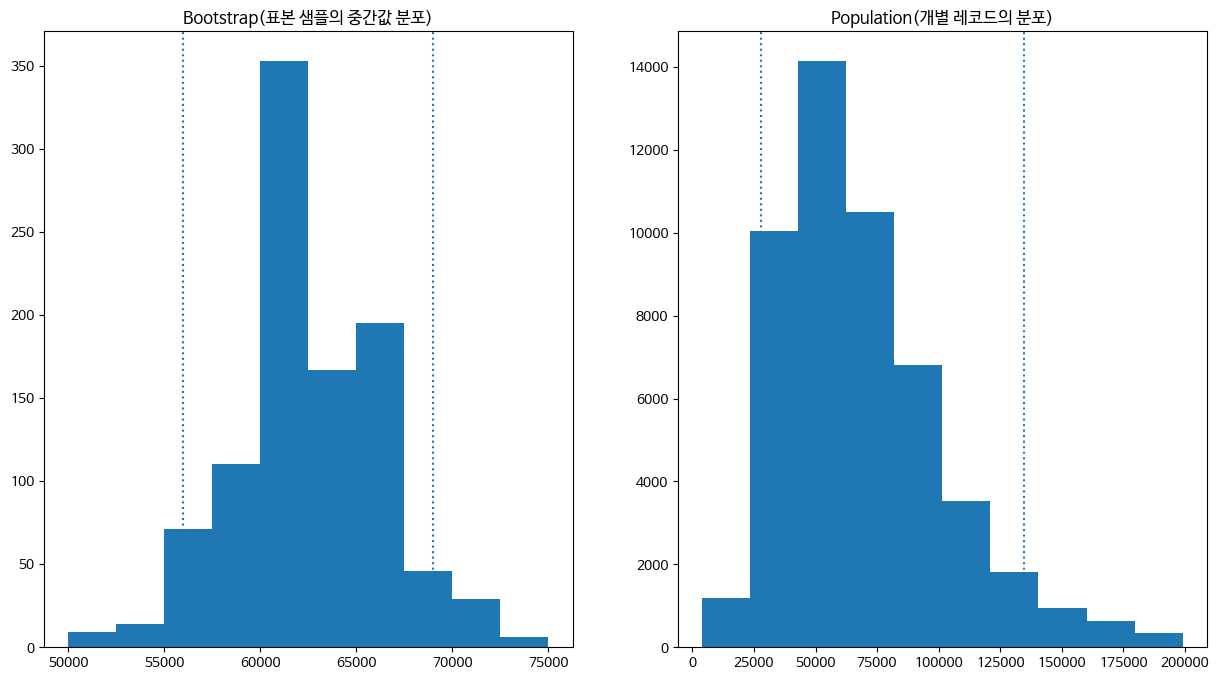
l = np.quantile(loans_income, q=((100-90)/2)*0.01)
h = np.quantile(loans_income, q=((100-(100-90)/2))*0.01)
l, h
(28000.0, 134607.40000000043)위와 같이 부트스트랩은 표본집단의 변동성을 파악할 수 있습니다. 엄격한 사전조건의 제한 없이 신뢰구간, p-value 등 고전 통계량을 추출할 수 있는 유연한 방법입니다.