%matplotlib inline

from pathlib import Path
import random

import pandas as pd
import numpy as np

import matplotlib.pylab as plt순열검정이란?
순열검정은 두 개 이상의 표본을 함께 결합하여 관측값들을 무작위로 재표본 추출하는 과정을 말합니다. 순열검정은 A/B 테스트 및 기타 검정을 위해 사용할 수 있습니다. A/B 테스트를 예로 들면, 그룹 간의 처리에 따른 결과가 다르지 않다는 귀무가설을 가정했다고 말할 수 있습니다.
순열검정의 과정
- 여러 그룹의 결과를 단일 데이터 집합으로 결합합니다.
- 결합된 데이터를 섞은 후, 각각의 그룹의 동일한 크기만큼 샘플을 비복원추출합니다.
- 추출된 재표본에 대한 통계량 및 추정치를 계산합니다.
… 위 과정을 R번 반복합니다.
실습
아래 코드를 통해 의미를 살펴보겠습니다.
session_times = pd.read_csv('https://raw.githubusercontent.com/gedeck/practical-statistics-for-data-scientists/master/data/web_page_data.csv')
session_times.Time = 100 * session_times.Time
ax = session_times.boxplot(by='Page', column='Time',
figsize=(4, 4))
ax.set_xlabel('')
ax.set_ylabel('Time (in seconds)')
plt.suptitle('')
plt.tight_layout()
plt.show()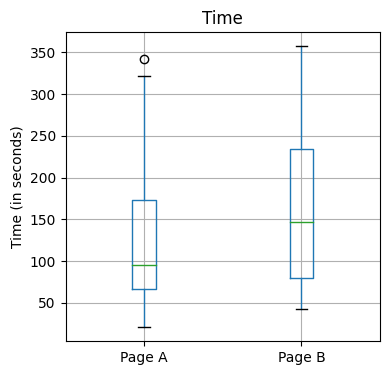
mean_a = session_times[session_times.Page == 'Page A'].Time.mean()
mean_b = session_times[session_times.Page == 'Page B'].Time.mean()
print(mean_b - mean_a)35.66666666666667Page A와 Page B 사이 평균의 차이가 존재하는 것을 볼 수 있습니다. 이 표본평균의 차이가 유의미한 차이를 보이는지 순열검정을 통해서 알 수 있습니다.
아래와 같이 순열검정을 위한 perm_fun 함수를 작성할 수 있습니다.
# Permutation test example with stickiness
def perm_fun(x, nA, nB):
    n = nA + nB # 그룹 A와 B의 관측 수를 더합니다.
    idx_B = set(random.sample(range(n), nB)) # 그룹 A와 그룹 B를 섞은 주머니에서, 그룹 B의 관측 수만큼 비복원 추출
    idx_A = set(range(n)) - idx_B # 그룹 B에 해당하지 않는 표본을 그룹 A에 할당
    return x.loc[list(idx_B)].mean() - x.loc[list(idx_A)].mean() # 재표본의 평균 차이를 계산
nA = session_times[session_times.Page == 'Page A'].shape[0]
nB = session_times[session_times.Page == 'Page B'].shape[0]
print(perm_fun(session_times.Time, nA, nB))-5.704761904761909perm_diffs = [perm_fun(session_times.Time, nA, nB) for i in range(1000)]fig, ax = plt.subplots(figsize=(5,5))
ax.hist(perm_diffs, bins=11, rwidth=0.9) # rwidth는 bar의 너비를 지정
ax.axvline(x= mean_b-mean_a, color='black', linewidth=2)
ax.text(50,200, 'Observed\ndifference', bbox={'facecolor':'white'})
ax.set_xlabel('Session time differences (in seconds)')
ax.set_ylabel('Frequency')
plt.show()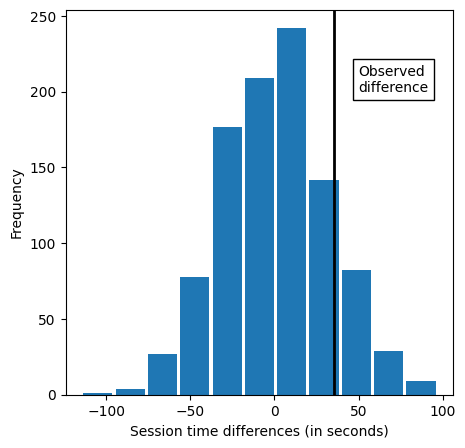
Peter C. Bruce의 Practical Statistics for Data Scientists 내용을 참고하여 작성되었습니다.